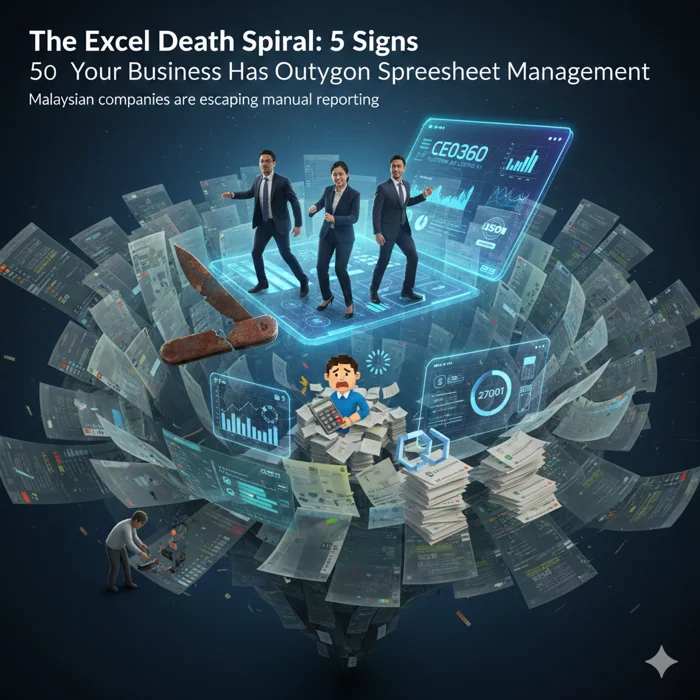
The Excel Death Spiral: 5 Signs Your Business Has Outgrown Spreadsheet Management
Your CFO shouldn’t need three days to answer a simple question about last quarter’s margins.
But if your company still runs on Excel, that is likely the reality. You download the data. You clean the formatting errors. You merge five different files. Then, you pray nothing breaks.
Microsoft Excel is like a Swiss Army Knife. It is flexible and easy to use. For a startup, it is perfect.
But you can’t build a skyscraper with a Swiss Army Knife.
As you add more customers and data, Excel stops helping you grow. It starts holding you back. We call this the Excel Death Spiral.
How do you know if you have hit the wall? Here are five clear signs and their fix.
Sign #1: The “Final_Final_v3.xlsx” Version Control Nightmare
You are in a Monday meeting. The Head of Sales shows a revenue figure. The CFO frowns. Her number is 12% different.
Why? Sales is using a spreadsheet from Friday. Finance updated theirs this morning.
When you rely on Excel, there is no “Single Source of Truth.” You email files, edit them on your desktop, and re-upload them. You end up with a folder full of confused files:
- Revenue_Report_FINAL.xlsx
- Revenue_Report_FINAL_v2.xlsx
- Revenue_Report_USE_THIS_ONE.xlsx
Sound familiar?
You can eliminate this chaos with a centralized data repository. instead of passing files around, everyone accesses the same live dashboard. When Sales and Finance look at the numbers, they see the exact same thing because they are pulling from the same source.
Sign #2: Your Team Spends 80% of Their Time Cleaning Data
This is the “Data Janitor” trap. Ask your finance team how they spend their week. Do they do this?
- Download CSVs from the CRM.
- Manually reformat dates (fixing DD/MM vs MM/DD).
- Copy-paste rows between sheets.
- Run the same VLOOKUP formulas every month.
If yes, you are wasting talent. Finance pros should be advisors, not data entry clerks.
Real Example: A manufacturing company in Penang tracked their time. They spent 23 hours per week just cleaning data. After switching to automated reporting, that dropped to under 4 hours. They used the extra time for cash flow forecasting.
You can flip this ratio by automating the ETL process (Extract, Transform, Load). This technical step pulls data from different systems and formats it automatically, so your team spends 20% of their time prepping data and 80% analyzing it.
Sign #3: The “Spinning Wheel of Death” (You’ve Hit Excel’s Limits)
Excel has a hard limit of about 1 million rows per sheet. That sounds like a lot. But transaction logs and marketing history fill that up fast.
If you have time to grab a coffee while your file opens, your system is broken. You probably split data into different files just to make it work:
- 2024_Q1_Data.xlsx
- 2024_Q2_Data.xlsx
Now, comparing Q1 to Q2 is a nightmare.
The better way is to move to a scalable architecture. A proper data platform processes millions of records instantly—no spinning wheels and no artificial file splits. You can query data from 2019 just as fast as data from yesterday.
Sign #4: One Broken Formula Destroys Credibility
Spreadsheets are fragile. One “fat finger” error or a broken cell reference (#REF!) can ruin your whole model.
Often, you don’t spot the error until a board meeting. Someone asks why the numbers don’t add up. Research suggests 88% of spreadsheets contain errors. This creates distrust, and executives start checking system reports with calculators.
You can restore trust with automated integrity. With a financial intelligence system, the math is built-in. The formulas are consistent and audit-proof, meaning no one can accidentally break the logic by deleting a cell.
Pro tip: Look for ISO 27001 certification. This proves the vendor passed strict security audits—something a password-protected Excel file cannot claim.
Sign #5: Data Is Trapped in Silos
Excel creates islands of information. Marketing data is in one file. Inventory is in another.
The problem starts when you ask a big question: “How did ad spend in Q1 impact inventory in Q3?”
To answer this in Excel, you need hours of complex VLOOKUP formulas. Usually, the effort is so high that people just give up. Strategy gets made on “gut feel” instead of data.
This is where AI-powered analytics shine. When your data sits in one consolidated repository, you can query across departments instantly. Modern platforms even let you ask in plain English: “Show me the correlation between marketing spend and revenue.”
Escaping the Death Spiral
If these signs look familiar, stop making more pivot tables. You don’t need a better spreadsheet. You need a modern financial data stack.
At Lestar.ai, we help Malaysian businesses escape the Excel Death Spiral by providing:
- Consolidation: We connect your ERP, CRM, and bank feeds into one secure place.
- Automation: We remove the “Data Janitor” work with automated ETL.
- Intelligence: Ask questions in plain English and get answers instantly.
- Security: Our company (Mandrill Tech Sdn Bhd) is ISO 27001 certified. Your data is safer than a password-protected Excel file.
Stop managing the spreadsheet. Start managing the business.
Ready to upgrade? See how Lestar.ai’s CEO360 platform gives your team real-time insights. [Book a Free Demo]
Frequently Asked Questions
When should a business stop using Excel for finance?
You have outgrown Excel if you have multiple data sources, more than 2–3 people editing files, or if reporting takes more than 2 days.
What is a centralized data repository?
It is a single, secure place where data from your ERP, CRM, and banks is collected automatically. Everyone sees the same real-time data.
How long does it take to switch?
Most mid-sized businesses are ready in 4–8 weeks. We connect to your existing systems, so you don’t have to rebuild everything.
Is my data secure?
Yes. Look for ISO 27001 certification. This is safer than storing files on local drives or emailing them.
Related Reading
- Best AI CFO Software in Malaysia: 2026 Buyer’s Guide — Full evaluation checklist for choosing the right platform.
- Best Cash Flow Forecasting Software for CFOs (2026) — AI-powered forecasting with 30, 60, and 90-day visibility.
- Top ESG Reporting Software in Malaysia — Discover modern alternatives to manual ESG reporting processes.