Key Takeaways
- Data aggregation software collects and consolidates raw data from multiple sources. BI dashboard software visualizes that data for decision-making. They are not the same tool.
- Most SMEs use three to seven disconnected data sources — ERP, CRM, spreadsheets, and accounting software — which means raw data rarely lands in one place automatically.
- Standalone BI tools require clean, centralized data before they can function. Without aggregation, dashboards show incomplete or stale numbers.
- For SME executives with no dedicated data engineering team, the practical answer is a combined platform that handles both aggregation and reporting in a single workflow.
- Lestar AI CEO 360 is built specifically for this gap: multi-source data integration plus AI-powered executive dashboards, designed for CEOs, CFOs, and COOs at companies with 10 to 500 employees.
Introduction
If you are a CEO, CFO, or COO at a small or mid-sized company, you have probably faced this question: “Do we need a data pipeline tool, or do we need a BI tool?” The answer that most vendors give you is: whichever one they are selling.
The honest answer is more useful. Data aggregation software and BI dashboard software solve two different problems that sit directly adjacent to each other. Understanding that distinction determines whether you spend the next six months deploying the wrong tool — or whether you solve your actual reporting problem in weeks.
This article is written for SME executives — not data engineers. It explains what each category of software does, where each falls short on its own, and what a combined platform looks like in practice.
What Is Data Aggregation Software?
Data aggregation software is a category of tool that automatically collects, consolidates, and normalizes data from multiple source systems — such as an ERP, CRM, accounting platform, or spreadsheets — into a single, unified data layer. Its primary job is to move raw data from where it lives into a place where it can be used. It does not typically produce visualizations or reports on its own.
What Is BI Dashboard Software?
Business intelligence (BI) dashboard software is a category of tool that transforms structured, pre-cleaned data into visual reports, charts, and dashboards for business decision-making. BI tools — such as Microsoft Power BI, Tableau, and Looker — assume that clean, centralized data already exists. They are built to display and analyze data, not to collect or move it.
Data Aggregation Software vs BI Dashboard Software — Key Differences
What They Do
Data aggregation software operates in the background. It connects to source systems via APIs or native integrations, extracts records on a defined schedule or in real time, applies transformation rules to normalize field names and formats, and loads the result into a central store. The output is structured, consistent data — not a report.
BI dashboard software operates at the front end. A business analyst or data team member connects it to a pre-existing data warehouse or database, builds data models, defines metrics, and creates dashboards that business users can read. The output is a visual report — not a data pipeline.
The two tools occupy different stages of the same chain. Aggregation comes first. Visualization comes second. Skipping the first step and going straight to BI is one of the most common — and most expensive — mistakes SMEs make.
Who They’re Built For
Data aggregation tools are typically bought and managed by IT teams, data engineers, or technical operations staff. Platforms such as Fivetran, Stitch, and Airbyte are purpose-built for data engineers who write transformation logic and manage connector configurations. These are not tools that a CFO opens on a Monday morning to check revenue.
BI tools have a wider intended audience — analysts, finance teams, and executives — but they carry a hidden assumption: that someone technical has already built the data pipeline underneath. According to Gartner’s research on analytics and BI platforms, the majority of BI project failures are attributable to poor data quality or lack of data integration upstream, not to the BI tool itself.
For SMEs, this creates a structural problem. The company does not have a data engineering team. The CFO cannot build a Fivetran pipeline. The CEO cannot write SQL. So the BI tool sits underutilized because the aggregation layer was never built.
Where They Fall Short for SME Executives
Data aggregation tools, used alone, deliver raw data to a destination — but they do not tell you what the data means. A pipeline that correctly loads your sales figures into a warehouse does not alert you when those figures are anomalous. It does not surface the fact that your Q3 receivables collection rate dropped 14 percentage points compared to the same period last year. You still need someone to build the analysis layer on top.
BI tools, used alone, require a working data layer that most SMEs do not have. A 2023 survey by TDWI (Transforming Data with Intelligence) found that organizations with fewer than 500 employees spend an average of 4.2 hours per week per analyst manually preparing and cleaning data before it can be loaded into a BI tool. For a company where the “analyst” is the CFO’s executive assistant, that cost is prohibitive.
The gap between raw operational data and an actionable executive view is real, measurable, and largely unsolved by either category of tool on its own.
Side-by-Side Comparison Table
| Feature | Data Aggregation Software | BI Dashboard Software | Combined Platform (e.g., CEO 360) |
|---|---|---|---|
| Primary function | Collect and consolidate raw data from multiple sources | Visualize and analyze structured data | Aggregate + visualize + analyze in one workflow |
| Typical buyer | IT team, data engineer | Data analyst, finance team | CEO, CFO, COO — no technical team required |
| Requires pre-existing data pipeline | No — it builds the pipeline | Yes — assumes clean data already exists | No — handles both layers |
| Produces executive dashboards | No | Yes | Yes |
| AI anomaly detection on KPIs | No | Rarely | Yes |
| Predictive / forecasting analytics | No | Sometimes, with add-ons | Yes, built in |
| Typical implementation time (SME) | 4–12 weeks with technical resources | 2–8 weeks (after data pipeline is ready) | Days to weeks, self-service |
| SME-appropriate pricing model | Per connector / per row / per user | Per user / per capacity | Flat subscription, executive seats |
| ERP + CRM + spreadsheet integration | Yes (core capability) | Depends on connectors | Yes (core capability) |
| No-code setup | Rarely | Sometimes | Yes |
Why SME Leaders Need Both — and the Case for a Combined Platform
The data supply chain for an SME executive looks like this: raw operational data lives in three to seven different systems. That data needs to be extracted, normalized, and unified before any meaningful analysis can happen. Once it is unified, an executive needs to see it in a form that drives decisions — not a spreadsheet, and not a raw database dump.
An enterprise with 5,000 employees solves this by hiring a team: a data engineer builds the pipeline, a data analyst builds the dashboards, and a data steward maintains data quality. The total annual cost of that team often exceeds $400,000 USD.
An SME with 50 to 200 employees cannot replicate this model. The CFO is doing their own reporting. The CEO is reading a monthly Excel file assembled by a finance assistant who spent two days on it. The COO has no visibility into operations data unless someone sends them a PDF.
The practical solution is a platform that collapses the data aggregation layer and the BI layer into a single product — one that is configured by a business user, not a data engineer. This is not a new concept in enterprise software; what has changed is that AI-driven automation now makes it feasible to offer this at a price point and complexity level appropriate for SMEs.
A combined platform provides three concrete benefits:
- Faster time to insight. You are not waiting for IT to build a pipeline before the dashboard works. Both layers are configured together.
- Lower total cost. One vendor, one contract, one support relationship — instead of a data pipeline tool plus a BI tool plus the engineering hours to connect them.
- AI that operates on complete data. Anomaly detection and predictive forecasting only work reliably when the underlying data is unified. A BI tool that only sees data from two out of five source systems will miss the anomaly that matters.
What to Look for in an Integrated Reporting Tool for SME Leaders
If you are evaluating tools in this category, these are the criteria that matter for an executive audience:
1. Native integrations with your actual source systems.
The tool should connect directly to the ERP, CRM, accounting software, and spreadsheets your company uses today — not require custom development for each connection. Every additional connector that requires engineering work adds cost and delay.
2. No-code or low-code setup.
If the onboarding process requires a data engineer or SQL knowledge, the tool is not designed for SME executives. The configuration interface should be accessible to a finance director or operations manager.
3. AI-driven alerting on KPIs — not just visualization.
Dashboards that require a human to spot an anomaly are a partial solution. Look for platforms that proactively surface when a KPI deviates from expected patterns — revenue recognition lag, margin compression, collections cycle extension — and alert the relevant executive automatically.
4. Unified executive view, not departmental siloes.
A BI tool that gives the sales team a sales dashboard and the finance team a finance dashboard still leaves the CEO without a unified picture. The executive layer should aggregate across functions.
5. Transparent data lineage.
Executives need to trust the numbers. The platform should be able to show, for any metric, which source system it came from and when it was last refreshed.
How Lestar AI CEO 360 Combines Data Aggregation + BI in One Platform
Lestar AI CEO 360 is an executive reporting platform built for SMEs with 10 to 500 employees. It is designed specifically for the scenario described in this article: a company that runs on multiple operational systems, has no dedicated data engineering team, and needs its senior leadership to have accurate, unified business intelligence without building a data pipeline from scratch.
What it does at the aggregation layer:
CEO 360 connects directly to ERP systems, CRM platforms, accounting software, and spreadsheets through pre-built integrations. Data from each source is automatically normalized and consolidated into a unified data layer on a configurable refresh schedule — no SQL, no custom connectors, no IT ticket required.
What it does at the reporting layer:
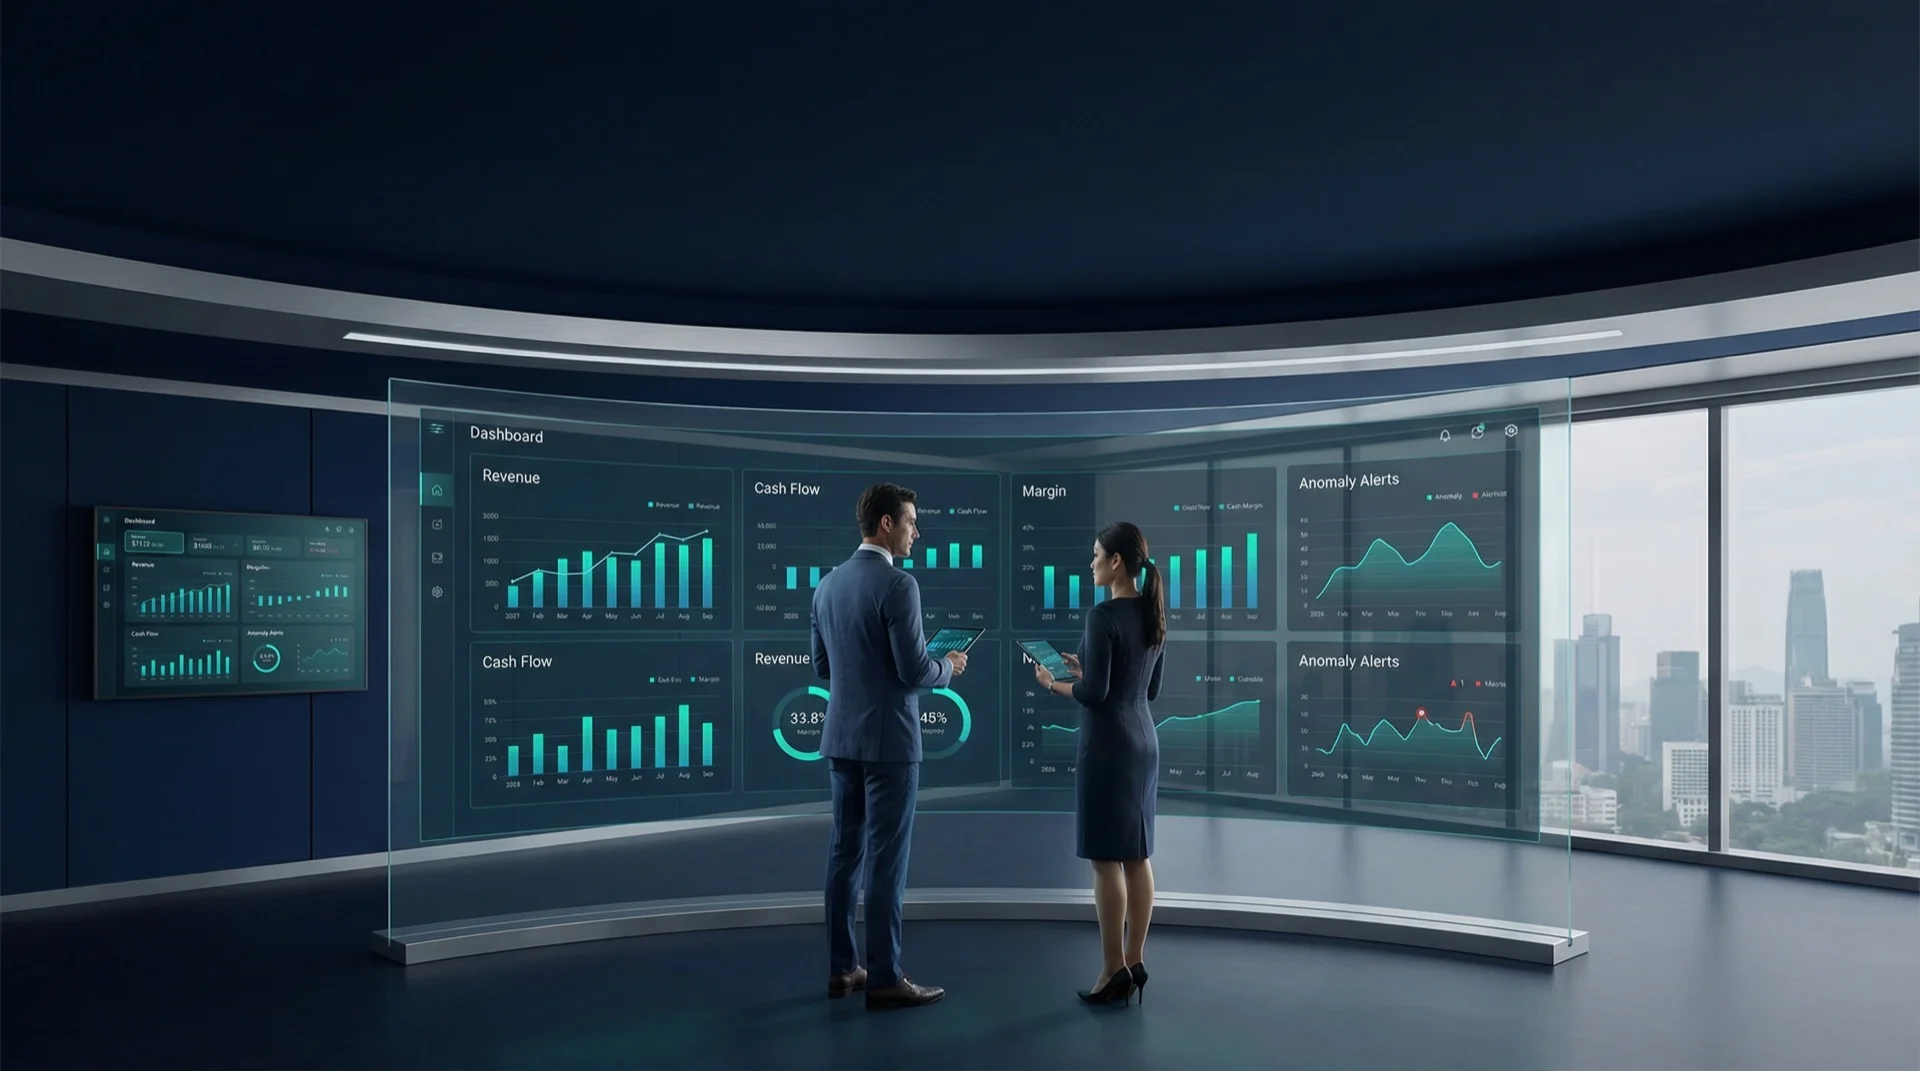
Once data is unified, CEO 360 generates an executive dashboard that surfaces the KPIs most relevant to senior leadership: revenue, margin, cash position, sales pipeline, operational throughput, and customer metrics — presented in a single view designed for a CEO, CFO, or COO, not a data analyst.
What it adds that neither standalone category provides:
AI anomaly detection runs continuously against the unified KPI layer. When a metric deviates from expected behavior — based on historical patterns and seasonality — CEO 360 surfaces the alert before the CFO discovers it in the monthly close. Predictive analytics modules provide forward-looking forecasts on revenue and cash flow, using the same unified data that feeds the dashboards.
The result: an SME executive gets the output that an enterprise data team would produce — in a product that a finance director can configure and operate without engineering support.
Ready to see it in action? Start a free trial or book a demo at lestar.ai.
Frequently Asked Questions
What is the difference between data aggregation software and a BI dashboard?
Data aggregation software collects and consolidates raw data from multiple source systems — such as your ERP, CRM, and accounting software — into a single, unified data layer. A BI dashboard visualizes that already-unified data for decision-making. Aggregation comes first; BI comes second. Most SMEs need both capabilities working together.
Can I use a BI tool like Power BI or Tableau without a data aggregation tool?
You can connect Power BI or Tableau directly to individual source systems, but you will be managing multiple separate connections, handling data conflicts manually, and missing a unified view. For SMEs running three or more operational systems, this approach creates significant manual overhead and data inconsistency risk that compounds over time.
How long does it take to set up a combined data aggregation and BI platform for an SME?
With a purpose-built combined platform such as Lestar AI CEO 360, initial setup for an SME typically takes days to a few weeks, depending on the number of source system integrations required. By contrast, building a standalone aggregation pipeline plus a separate BI layer — with engineering resources — commonly takes two to six months and costs significantly more in labor.
What data sources should an SME executive reporting platform connect to?
At minimum, an SME executive platform should connect to the company’s primary ERP or accounting software, its CRM, and any spreadsheets used for operational tracking. Additional high-value sources include payroll systems, e-commerce platforms, and project management tools. The more source systems are unified, the more complete and reliable the executive view becomes.
Do small and mid-sized businesses really need AI in their reporting tools?
AI in an SME reporting context is not about complexity — it is about surfacing problems before they become visible in lagging indicators. Anomaly detection on KPIs means that a CFO does not need to manually scan dozens of metrics each week to find the one that moved unexpectedly. For an SME executive wearing multiple hats, that automated alerting is practically valuable, not a luxury feature.
Conclusion
The confusion between data aggregation software and BI dashboard software is understandable. They are adjacent tools that vendors often conflate, and the distinction only becomes obvious when you deploy one and discover that the other is still missing.
The direct answer to the opening question — “do I need a data pipeline tool or a BI tool?” — is that you need both, and for most SME executives, the lowest-cost and lowest-risk path to getting both is a single platform that handles the aggregation layer and the executive reporting layer together.
For CEOs, CFOs, and COOs at companies with 10 to 500 employees, Lestar AI CEO 360 is built for exactly this gap. It connects to your existing ERP, CRM, accounting software, and spreadsheets, unifies the data automatically, and delivers an AI-powered executive dashboard — without requiring a data engineering team to make it work.
If your current reporting process involves waiting for someone to compile a spreadsheet, or if your BI tool dashboards are only as current as the last manual data export, that is the problem CEO 360 is designed to solve.
Book a demo or start a free trial at lestar.ai — and see a unified executive view of your business in days, not months.