Financial Reporting Automation: Why We Built a Centralized Repository Instead of Another Dashboard
We didn’t set out to build Lestar.ai just to create another software tool. The market is already flooded with BI tools, visualization dashboards, and “smarter” spreadsheets.
We built Lestar because of a specific, painful pattern we observed in boardrooms across every industry—from mid-sized tech firms to large manufacturing conglomerates. We saw brilliant Finance Directors and Data Teams spending 80% of their time acting as “data janitors” and only 20% acting as strategists.
Let me share a composite example of what we saw. Let’s call them “Company X.”
Company X was a successful enterprise with over $50M in revenue. Yet, every month-end, the finance department went into a state of panic.
- Their sales data lived in Salesforce.
- Their invoices were in NetSuite/Xero.
- Their operational metrics were buried in hundreds of disjointed spreadsheets.
- Their ESG compliance data was trapped in PDF attachments from suppliers.
Despite spending thousands on “modern tech,” their actual reporting process relied on three analysts manually copy-pasting numbers into a master Excel sheet. By the time the report reached the CEO, the data was two weeks old and often contained manual errors.
We realized that financial reporting automation was failing not because the charts weren’t pretty enough, but because the data foundation was broken.
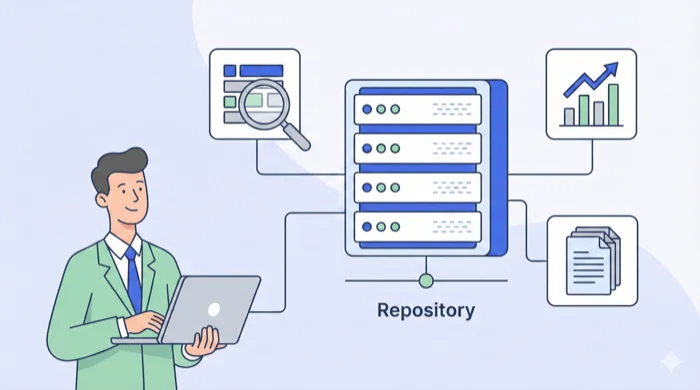
We saw that companies didn’t need another dashboard. They needed a Centralized Data Repository—a single brain that could ingest this scattered data, clean it, and serve it up instantly. That is why we built Lestar: to stop the manual data plumbing and enable true, real-time insights.
The Real Bottleneck: Why Most “Automated Reporting” Fails
When most leaders search for automated reporting, they are usually looking for a quick fix to visualize their data faster. They often ask, “How to automate Power BI reports?” or “How to automate Tableau reports?” hoping that a better visualization tool will solve their problems.
But visualization tools are just the paint on the walls. If the house’s foundation is cracking, the paint doesn’t matter.
Through our work in the industry, we identified that the primary bottleneck to automation is Data Fragmentation.
Here is why the traditional “Dashboard First” approach fails for high-growth companies:
- The Connector Fatigue: To get a full picture of your company’s health (the “CEO 360” view), you need to connect your ERP, CRM, and HRIS. Most visualization tools require complex, brittle integrations that break whenever a software updates.
- The “Human Middleware”: Without a centralized repository, humans become the bridge between systems. You are paying high-salaried finance experts to do low-value data cleaning.
- Lack of Context: A standard dashboard can tell you what happened (e.g., “Revenue is down 5%”). But it can’t tell you why because it lacks the contextual data from other departments.
True financial reporting automation requires a shift in architecture. It requires moving from “connecting apps” to “centralizing data.”
How to Automate Financial Reports (The Modern Way)
If you are a CFO or Data Lead looking to fix this process, the goal is to move from “Static Reporting” to “Dynamic Intelligence.” Here is how a Centralized Data Repository (like Lestar) changes the workflow compared to traditional methods.
1. Centralize Your Sources (The “CEO 360” Foundation)
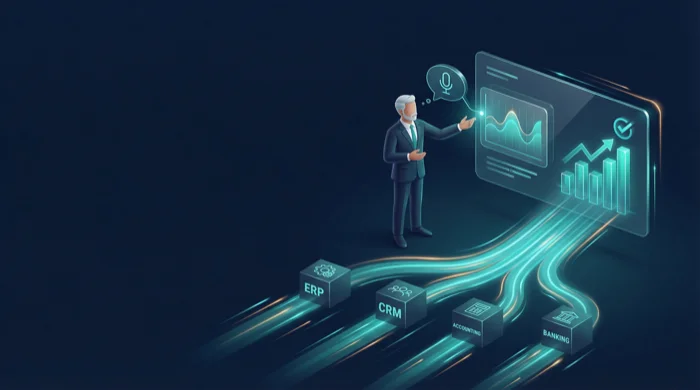
The first step isn’t drawing a chart; it’s ingestion. You need a tool that can pull data from structured sources (SQL databases, ERPs) and unstructured sources (documents, PDFs) into one secure location.
- Old Way: Download CSV from ERP $\rightarrow$ Email to Analyst $\rightarrow$ Upload to Excel.
- Lestar Way: The repository connects directly to the API of your ERP and CRM, pulling data automatically every hour.
2. Automate the “Dirty Work” (Cleaning & Mapping)
This is where financial reporting automation delivers ROI. Data from different systems rarely matches. Your CRM might say “Q1 Revenue,” while your ERP says “First Quarter Sales.”
- Old Way: A human manually reconciles these differences in a spreadsheet lookup table.
- Lestar Way: AI algorithms automatically map and standardize these terms, creating a “Single Source of Truth” without human intervention.
3. AI-Driven “Text-to-Insight”
This is the highest level of intent. Executives don’t want to learn how to filter a pivot table. They want answers.
- The Shift: Instead of asking an analyst to build a new report, you simply ask the repository: “Show me the EBITDA variance against the Q1 forecast breakdown by region.”
- The system understands the context, pulls the specific data points, and generates the report instantly.
High-Value Use Cases for Automated Reporting
We designed Lestar to tackle the most complex reporting environments where simple tools fail.
Corporate Finance (The CEO 360)
For the CEO, speed is everything. They cannot wait until the 15th of the month to know cash flow status.
- Application: Automated P&L, Cash Flow analysis, and Burn Rate monitoring.
- Benefit: Shifts the Finance team from “Scorekeepers” (reporting what happened) to “Strategic Partners” (advising on what to do next).
Automated Client Reporting
Agencies and consultancies waste hundreds of hours building monthly PDFs for clients.
- Application: Providing clients with a secure, read-only view of their campaign or project performance metrics in real-time.
- Benefit: Increases client trust and retention by providing total transparency.
ESG & Compliance Reporting
Sustainability reporting is the new financial reporting. It requires gathering data from supply chains, energy bills, and HR records.
- Application: Centralizing carbon footprint data from disparate sources.
- Benefit: Audit-ready data trails that ensure compliance without the manual scramble during audit season.
How to Choose an Automated Reporting Tool in 2025
If you are currently evaluating tools, you might be wondering how to choose an automated reporting tool that actually scales.
Don’t just look at the charts; look at the engine. Use this checklist to filter for high-intent, enterprise-grade solutions:
- Is it a Repository or just a Viewer?
- Avoid tools that just layer on top of your existing messy data. Choose a tool that ingests and centralizes the data first.
- Does it handle Unstructured Data?
- Financial and ESG data often live in invoices and contracts. If the tool can only read Excel rows, it’s incomplete. Look for AI that understands documents.
- Is the “Intelligence” actually intelligent?
- Many tools claim “AI” but only offer trend lines. Look for Generative AI capabilities that allow you to query your data using natural language.
Stop Managing Spreadsheets. Start Managing Strategy.
The era of manual reporting is ending. Your talent is too expensive to be wasted on copy-pasting rows in Excel.
At Lestar, we fixed the scattered data problem so you can finally achieve true financial reporting automation. Don’t just visualize your data—centralize it, clean it, and master it.
Ready to see your business in real-time? [Book a generic CEO 360 Demo with Lestar today].